I wanted to see how long it would take to repro what I did in 2013 with DeepChem.
Turns out when you do something for a job you get much better at it.

Games highlighted in green were predicted to be within 2 points.
About the Model
The model uses a dense neural network with the following feature values from kenpom. All analysis was done using DeepChem. You can get into my head and walk through what I did here.
The final Network had a structure of
76 features per game -> 64 relu (0.35 dropout)-> 32 relu (0.35 dropout)-> 1 linear
These are the features used
- RankAdjOE
- RankAdjDE
- RankAdjTempo
- RankAPL_Off
- RankAPL_Def
- RankeFG_Pct
- RankDeFG_Pct
- RankTO_Pct
- RankDTO_Pct
- RankOR_Pct
- RankDOR_Pct
- RankFT_Rate
- RankDFT_Rate
- RankDFT_Rate
- RankFG3Pct
- RankFG3Pct&od=d
- RankFG2Pct
- RankFG2Pct&od=d
- RankFTPct
- RankFTPct&od=d
- RankBlockPct
- RankBlockPct&od=d
- RankStlRate
- RankStlRate&od=d
- RankF3GRate
- RankF3GRate&od=d
- RankARate
- RankARate&od=d
- RankOff_3
- RankDef_3
- RankOff_2
- RankDef_2
- RankOff_1
- RankDef_1
- RankSOSO
- RankSOSD
- ExpRank
- SizeRank
To play a “game” we append the two teams feature vectors and the network learns the final score with positive values if the first team won. We “play” the game in both orientations and average the results.
Model Performance
We classify based on the sign of the result 74% of games correctly given a random holdout.
For core prediction we get a pearson r^2 of 0.5 from a random split holdout set, bootstrapped and averaged over 5 trials. You can see the misclassifications highlighted in red.

We see very good enrichment and trend, but the vertical gap is still large.
Feature Importance
After throwing the model through LIME
for model interpretability the most important features were Adjusted Offensive Efficiency,
Strength of Schedule Offense, and Strength of Schedule Defense.

Viewing as Win Probabilities
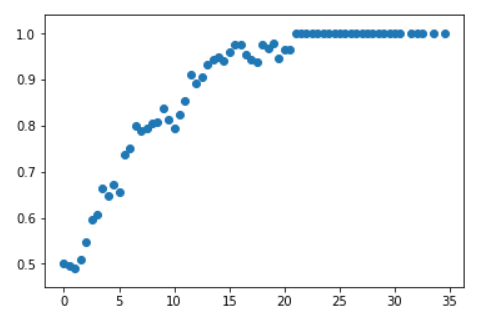
We can view the point spreads as win probabilities. We can round predictions to half points and then use the probability of winning as the probability that we predicted correctly over our holdout cross validation sets.

You can see how we get fewer and fewer games the more of a blowout the game is.

Plotting win percentage vs game diff gives the approximate shape we would expect. However it is a bit more bumpy than I would like.

To fix this I convolved over a length 3 uniform distribution filter.

Now that we can convert point spreads to probabilities we can do all the fun tables that kenpom and 538 do for bracket predictions using monte-carlo simulation.
| Team | R 32 | Sweet 16 | Elite 8 | Final 4 | Championship | Champion |
|---|---|---|---|---|---|---|
| Virginia | 1.00 | 0.80 | 0.65 | 0.43 | 0.30 | 0.17 |
| Duke | 1.00 | 0.84 | 0.57 | 0.43 | 0.24 | 0.15 |
| Villanova | 1.00 | 0.82 | 0.60 | 0.37 | 0.23 | 0.14 |
| Purdue | 1.00 | 0.80 | 0.53 | 0.31 | 0.18 | 0.10 |
| Cincinnati | 0.96 | 0.74 | 0.49 | 0.27 | 0.15 | 0.07 |
| North+Carolina | 1.00 | 0.76 | 0.46 | 0.29 | 0.15 | 0.07 |
| Michigan+St. | 0.94 | 0.67 | 0.31 | 0.20 | 0.09 | 0.05 |
| Michigan | 0.85 | 0.62 | 0.33 | 0.18 | 0.08 | 0.03 |
| Kansas | 0.94 | 0.66 | 0.39 | 0.16 | 0.07 | 0.03 |
| Xavier | 1.00 | 0.66 | 0.35 | 0.17 | 0.07 | 0.03 |
| Texas+Tech | 0.94 | 0.62 | 0.28 | 0.12 | 0.06 | 0.03 |
| Tennessee | 0.98 | 0.69 | 0.32 | 0.12 | 0.06 | 0.02 |
| Gonzaga | 0.91 | 0.50 | 0.28 | 0.14 | 0.05 | 0.02 |
| West+Virginia | 0.81 | 0.46 | 0.19 | 0.08 | 0.04 | 0.02 |
| Auburn | 0.96 | 0.54 | 0.28 | 0.08 | 0.03 | 0.01 |
| Ohio+St. | 0.81 | 0.43 | 0.23 | 0.10 | 0.03 | 0.01 |
| Wichita+St. | 0.94 | 0.49 | 0.14 | 0.05 | 0.02 | 0.01 |
| Kentucky | 0.75 | 0.42 | 0.11 | 0.05 | 0.02 | 0.01 |
| Clemson | 0.75 | 0.39 | 0.18 | 0.05 | 0.01 | 0.00 |
| Arizona | 0.81 | 0.46 | 0.12 | 0.04 | 0.02 | 0.00 |
| Florida | 0.67 | 0.29 | 0.09 | 0.03 | 0.01 | 0.00 |
| TCU | 0.66 | 0.24 | 0.06 | 0.03 | 0.01 | 0.00 |
| Texas+A%26M | 0.67 | 0.18 | 0.08 | 0.03 | 0.01 | 0.00 |
| Houston | 0.65 | 0.26 | 0.08 | 0.03 | 0.01 | 0.00 |
| Creighton | 0.55 | 0.11 | 0.06 | 0.02 | 0.01 | 0.00 |
| Nevada | 0.49 | 0.14 | 0.06 | 0.02 | 0.01 | 0.00 |
| Missouri | 0.51 | 0.17 | 0.07 | 0.02 | 0.01 | 0.00 |
| Seton+Hall | 0.51 | 0.19 | 0.09 | 0.02 | 0.01 | 0.00 |
| Florida+St. | 0.49 | 0.17 | 0.07 | 0.02 | 0.01 | 0.00 |
| Texas | 0.51 | 0.11 | 0.05 | 0.01 | 0.00 | 0.00 |
| Butler | 0.49 | 0.10 | 0.04 | 0.01 | 0.00 | 0.00 |
| Miami+FL | 0.55 | 0.19 | 0.05 | 0.02 | 0.00 | 0.00 |
| Virginia+Tech | 0.51 | 0.08 | 0.03 | 0.01 | 0.00 | 0.00 |
| Kansas+St. | 0.45 | 0.09 | 0.04 | 0.01 | 0.00 | 0.00 |
| Oklahoma | 0.60 | 0.11 | 0.03 | 0.01 | 0.00 | 0.00 |
| Arkansas | 0.51 | 0.10 | 0.04 | 0.01 | 0.00 | 0.00 |
| North+Carolina+St. | 0.49 | 0.14 | 0.05 | 0.01 | 0.00 | 0.00 |
| Alabama | 0.49 | 0.10 | 0.03 | 0.01 | 0.00 | 0.00 |
| Arizona+St. | 0.34 | 0.08 | 0.02 | 0.01 | 0.00 | 0.00 |
| Loyola+Chicago | 0.45 | 0.12 | 0.03 | 0.01 | 0.00 | 0.00 |
| UCLA | 0.33 | 0.08 | 0.02 | 0.00 | 0.00 | 0.00 |
| San+Diego+St. | 0.35 | 0.09 | 0.02 | 0.00 | 0.00 | 0.00 |
| Rhode+Island | 0.40 | 0.04 | 0.01 | 0.00 | 0.00 | 0.00 |
| Davidson | 0.25 | 0.08 | 0.01 | 0.00 | 0.00 | 0.00 |
| Providence | 0.33 | 0.07 | 0.02 | 0.00 | 0.00 | 0.00 |
| New+Mexico+St. | 0.25 | 0.06 | 0.01 | 0.00 | 0.00 | 0.00 |
| South+Dakota+St. | 0.19 | 0.04 | 0.01 | 0.00 | 0.00 | 0.00 |
| Montana | 0.15 | 0.04 | 0.01 | 0.00 | 0.00 | 0.00 |
| Buffalo | 0.19 | 0.05 | 0.00 | 0.00 | 0.00 | 0.00 |
| Murray+St. | 0.19 | 0.04 | 0.00 | 0.00 | 0.00 | 0.00 |
| UNC+Greensboro | 0.09 | 0.02 | 0.00 | 0.00 | 0.00 | 0.00 |
| Georgia+St. | 0.04 | 0.01 | 0.00 | 0.00 | 0.00 | 0.00 |
| Penn | 0.06 | 0.01 | 0.00 | 0.00 | 0.00 | 0.00 |
| Bucknell | 0.06 | 0.01 | 0.00 | 0.00 | 0.00 | 0.00 |
| Stephen+F.+Austin | 0.06 | 0.01 | 0.00 | 0.00 | 0.00 | 0.00 |
| Marshall | 0.06 | 0.00 | 0.00 | 0.00 | 0.00 | 0.00 |
| College+of+Charleston | 0.04 | 0.00 | 0.00 | 0.00 | 0.00 | 0.00 |
| Wright+St. | 0.02 | 0.00 | 0.00 | 0.00 | 0.00 | 0.00 |
| UMBC | 0.00 | 0.00 | 0.00 | 0.00 | 0.00 | 0.00 |
| Lipscomb | 0.00 | 0.00 | 0.00 | 0.00 | 0.00 | 0.00 |
| Texas+Southern | 0.00 | 0.00 | 0.00 | 0.00 | 0.00 | 0.00 |
| Iona | 0.00 | 0.00 | 0.00 | 0.00 | 0.00 | 0.00 |
| Cal+St.+Fullerton | 0.00 | 0.00 | 0.00 | 0.00 | 0.00 | 0.00 |
| Radford | 0.00 | 0.00 | 0.00 | 0.00 | 0.00 | 0.00 |
Power Rankings or Matchups
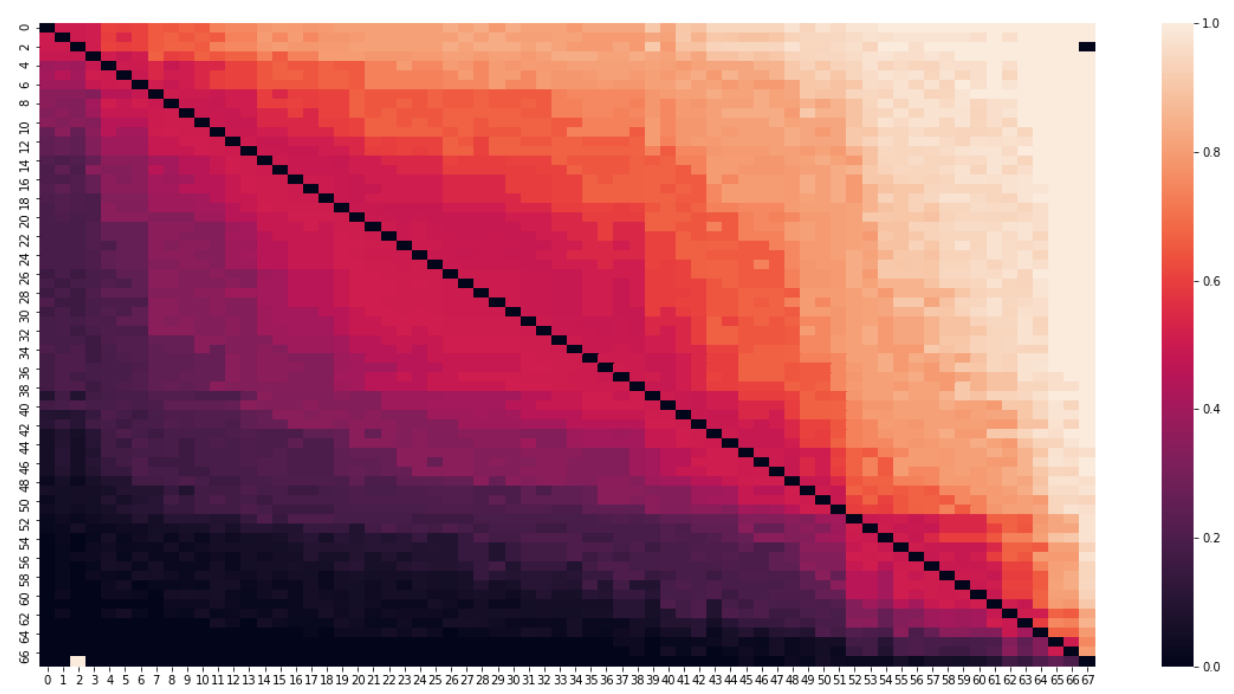
Is the model learning power rankings or is it learning matchups?

This is the probability that any team beats any other team in the bracket. It is ordered by my models own internal power ranking. You can see that it generally follows power its own internal power ranking but with slight variation.
The one outlier is my model somehow thinking that North Carolina Central will stomp on Villanova. It could be due to a bug or just that the game is so far out of the realm of games that have ever happened that my model has no basis.
Play Ins
Radford,LIU+Brooklyn,10.799
Arizona+St.,Syracues,1.744
UCLA,St.+Bonaventure,4.364
Texas+Southern,North+Carolina+Central,11.077
Round of 64
Virginia,UMBC,+47.410909143249825
Creighton,Kansas+St.,+3.7489317412863414
Kentucky,Davidson,+11.535352463049916
Arizona,Buffalo,+17.220292130042335
Miami+FL,Loyola+Chicago,+3.612004385758346
Tennessee,Wright+St.,+36.12079217409836
Nevada,Texas,+1.951813175863908
Cincinnati,Georgia+St.,+30.113146119838323
Xavier,Texas+Southern,+50.37626510178494
Missouri,Florida+St.,+1.1025389096046099
Ohio+St.,South+Dakota+St.,+18.6005472988174
Gonzaga,UNC+Greensboro,+22.951239992514456
Houston,San+Diego+St.,+7.958873435265513
Michigan,Montana,+21.881586360085134
Texas+A%26M,Providence,+9.10223822731434
North+Carolina,Lipscomb,+41.603373846286296
Villanova,Radford,+49.80577092134371
Virginia+Tech,Alabama,+2.6066752386376972
West+Virginia,Murray+St.,+18.60793528469507
Wichita+St.,Marshall,+28.524018057158784
Florida,UCLA,+8.78494577122894
Texas+Tech,Stephen+F.+Austin,+33.78383539028084
Arkansas,Butler,+1.7827628925168209
Purdue,Cal+St.+Fullerton,+46.85774918254356
Kansas,Penn,+35.25468398940229
Seton+Hall,North+Carolina+St.,+2.7196226800980585
Clemson,New+Mexico+St.,+11.673416554987885
Auburn,College+of+Charleston,+29.591478905605584
TCU,Arizona+St.,+7.444786319558336
Michigan+St.,Bucknell,+34.666868401820324
Rhode+Island,Oklahoma,+5.085826803251746
Duke,Iona,+47.03391869235143
Round of 32
Virginia,Creighton,+16.113167913280616
Kentucky,Arizona,+0.6839617522146398
Miami+FL,Tennessee,+8.678405542064755
Nevada,Cincinnati,+11.316839007178874
Xavier,Florida+St.,+8.208375980632464
Ohio+St.,Gonzaga,+1.85090095497707
Houston,Michigan,+8.72343837880933
Texas+A%26M,North+Carolina,+11.430504564039188
Villanova,Virginia+Tech,+18.344749956415477
West+Virginia,Wichita+St.,+4.362393108981096
Florida,Texas+Tech,+5.24062414324332
Butler,Purdue,+14.925006326029575
Kansas,Seton+Hall,+9.882623292777138
Clemson,Auburn,+1.4857501037939909
TCU,Michigan+St.,+8.925556213737597
Oklahoma,Duke,+19.266296711000233
Round of 16
Virginia,Kentucky,+15.228821000709875
Tennessee,Cincinnati,+6.174240971708502
Xavier,Gonzaga,+1.2333574795101763
Michigan,North+Carolina,+3.266797786524817
Villanova,West+Virginia,+9.769149390972059
Texas+Tech,Purdue,+5.224879981704366
Kansas,Auburn,+4.3595497807800525
Michigan+St.,Duke,+5.902065701946304
Round of 8
Virginia,Cincinnati,+4.103992750785233
Xavier,North+Carolina,+4.835349585538642
Villanova,Purdue,+3.064758428736159
Kansas,Duke,+9.975918350133703
Round of 2
Virginia,North+Carolina,+5.808692091184689
Villanova,Duke,+0.13683682844858347
Round of 1
Virginia,Duke,+0.44594562130204835
Misc Notes
Despite being based on Kenpom data my network is not nearly as high on Gonzaga as Kenpom.
The feature vector we have is lacking in a number of ways.
Now that it is done I wish I modelled as a classification task. Doing this would allow me to use game win weighting as a hyper-parameter. From the results of that I could infer whether 1 point wins were actually valuable and repeatable or luck. Also I could do all the cool bayes stuff that 538 does for it’s infographic.
Missing Features
We can add home field advantage in this scheme fairly easily. I also didn’t encode defensive fingerprint data from kenpom as a one-hot encoded value.
Player Values
These team fingerprints are also a snapshot in time, they don’t cover things like players going on and coming back from injury.